How to use Curve Fit Online Tool?
This is an online tool for curve fitting.
Usage:
1. Type X and Y values. You can add rows to the table by using the button below the table.
2. Choose fit method using the dropdown menu.
3. Results are generated automatically.
You can:
- export the report to PDF using "GENERATE PDF" button.
- export the report to TXT using "EXPORT TXT" button.
- manipulate diagram (for example zoom in or out)
- save diagram as PNG.
Contact: contact@softinery.com
Instruction of Curve Fit Online Tool
This is an online tool for curve fitting.
Usage:
1. Type X and Y values. You can add rows to the table by using the button below the table.
2. Choose fit method using the dropdown menu.
3. Results are generated automatically.
You can:
- export the report to PDF using "GENERATE PDF" button.
- export the report to TXT using "EXPORT TXT" button.
- manipulate diagram (for example zoom in or out)
- save diagram as PNG.
Contact: contact@softinery.com
Exponential Regression Calculator Documentation
Exponential Model
In exponential regression, the following equation is used:
An exponential function is used to describe processes with rapid growth or decay of some quantity. Examples include:
- Growth of bacteria
- Radioactive decay
- Chemical reaction kinetics
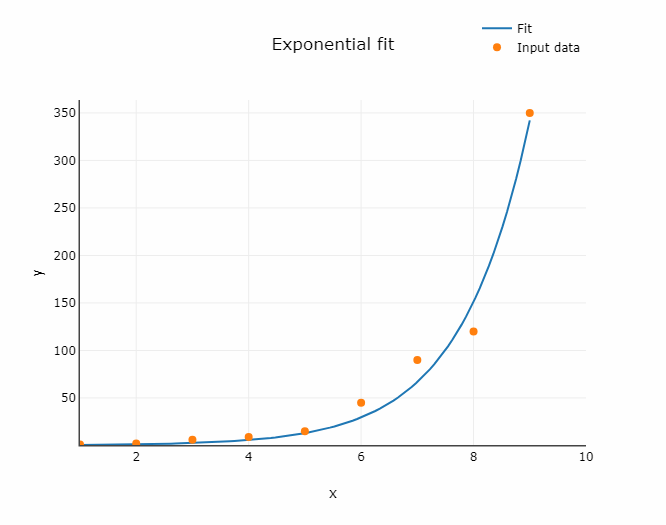
Fig. 1. Exponential fit illustration
Data Input
In the table on the left side of the application, input your data: x and y variables. You can add rows if you need to introduce more data. You can also paste a dataset from an Excel worksheet using Ctrl+C (Copy) and Ctrl+V (Paste) shortcuts.
Exporting Results
The calculations are performed automatically after entering the data into the table. You will see the plot with the fitted curve and parameters describing the quality of fit. The axes of the graph can be changed, as well as the title of the plot. You can export the results to a .txt file.
How to Calculate the Exponential Regression Formula
-
Prepare Your Data
Collect your data points, consisting of pairs of x (independent variable) and y (dependent variable) values. Ensure that you have at least two data points to perform the regression. -
Transform the Data
To linearize the exponential relationship, take the natural logarithm of the y values. This will transform the exponential equation:into a linear form:
The transformed equation is now suitable for linear regression, where ln(y) is treated as the dependent variable.
-
Perform Linear Regression
Use the linear regression method on your transformed data (x, ln(y)) to find the best-fit line. The equation of the line will be:where is the intercept and is the slope.
- Coefficient corresponds to
ln(a)and coefficient corresponds tob.
- Coefficient corresponds to
Tutorial on Working with the Curve Fitting Tool
For more information, watch this tutorial:
Working with the Curve Fitting Tool