How to use Curve Fit Online Tool?
This is an online tool for curve fitting.
Usage:
1. Type X and Y values. You can add rows to the table by using the button below the table.
2. Choose fit method using the dropdown menu.
3. Results are generated automatically.
You can:
- export the report to PDF using "GENERATE PDF" button.
- export the report to TXT using "EXPORT TXT" button.
- manipulate diagram (for example zoom in or out)
- save diagram as PNG.
Contact: contact@softinery.com
Instruction of Curve Fit Online Tool
This is an online tool for curve fitting.
Usage:
1. Type X and Y values. You can add rows to the table by using the button below the table.
2. Choose fit method using the dropdown menu.
3. Results are generated automatically.
You can:
- export the report to PDF using "GENERATE PDF" button.
- export the report to TXT using "EXPORT TXT" button.
- manipulate diagram (for example zoom in or out)
- save diagram as PNG.
Contact: contact@softinery.com
Linear Regression Calculator Documentation
Definition of Linear Regression
It is a type of statistical method used to find a linear relationship between two variables—independent and dependent. This method is also called "simple linear regression." There is also multiple linear regression, which finds the linear relationship between more than one independent variable and one dependent variable.
The best-fitting line is obtained by minimizing the sum of the squared errors, which are the differences between the predicted and the actual values.
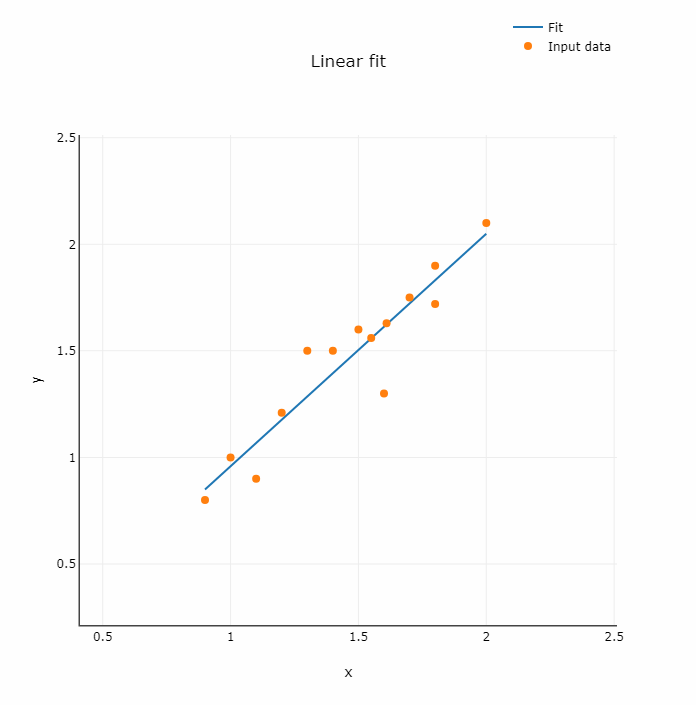
Fig. 1. Chart of regression line fitted to data
Linear Regression Equation
The equation of the regression line is:
where:
- - intercept
- - slope
- - independent variable
- - dependent variable
You can use our tool as a linear regression calculator by choosing "Linear fit" from the dropdown menu ("Choose fit method"). The calculator will automatically determine the regression equation with coefficients.
How to Calculate Linear Regression?
The regression coefficient is given by:
and is calculated as:
Where Linear Regression Analysis is Used?
Linear regression analysis is a fundamental technique in statistics and has a wide range of applications across various fields such as:
- Economy
- Social sciences
- Data science
- Sport analytics
- Engineering
Linear regression can also help analyze phenomena in environmental science or the manufacturing industry.
Least Squares Method
The least squares method is a mathematical procedure for finding the best-fitting curve to a given set of points. It is based on minimizing the sum of the squares of the residuals of the points from the curve (SSE - Sum of Squared Error). It is defined as:
where:
- - value of at point
- - predicted value of at point
The function SSE is minimized to find the best fit line.
The condition for SSE to be a minimum is:
for .
Measures of Goodness
R-Squared
The coefficient of determination, also denoted , is a statistical measure that shows how well the regression model fits the data. It represents the proportion of variance in the dependent variable that can be explained by the independent variable. The formula for calculating is:
Typically, is in the range of 0 and 1. A higher value (closer to one) implies that more variation is explained by the model. An of 1 indicates that the model predictions perfectly fit the observed data. The coefficient of determination is the square of the correlation coefficient.
Sum of Squared Errors (SSE)
The sum of squared errors is defined as: